
Size charts on phones: why image charts fail
An image chart made on a desktop shrinks to the width of a phone, so its numbers get too small to read, and it can't switch units, be searched or be read aloud. A real table in a panel that slides up from the bottom, with headers that stay put and big tap targets, fixes all of it.
Most size charts start as a spreadsheet, get exported as an image and pasted into the product page. On a computer that looks fine. On a phone, the image shrinks to the width of the screen and its text shrinks with it. The fix isn't a bigger image. It's a real table, made of text, in a panel built for a phone.
Why image charts fail on phones
The text shrinks with the picture
An image keeps its proportions. A chart laid out for a wide screen, with a column for every size, has to fit a phone held upright, so every number in it gets smaller. Shoppers pinch to zoom, pan sideways, lose the header row, and pan back to find out which size they were reading.
No unit switch
The units are baked into the pixels. A shopper who thinks in inches gets centimeters, or the other way around, unless you make two images or cram both units into one table that's twice as dense. How the conversion works, fractions included, is in centimeters to inches for size charts.
Nothing to search, copy or translate
Text inside an image is not text to the browser. Find in page doesn't see it, the shopper can't copy a measurement, and a browser's automatic translation skips it. Search engines read the words of a page; for a picture, they lean on the alt text you wrote.
Nothing for screen readers or larger text
A screen reader reads the image's alt text, often just "size chart", and stops. A real table is read cell by cell, with its row and column headers. Shoppers who turn up the text size on their phone get bigger text everywhere except in your chart. And in dark mode, the image stays a bright white rectangle.
Every change is a new image
Fix one value and you export the image again, then replace it on every product that uses it.
What works instead
A real table
A table made of text stays sharp at any size, grows with the phone's text settings, converts units, translates, and can be read aloud. Everything else on this list builds on it.
A panel that slides up from the bottom
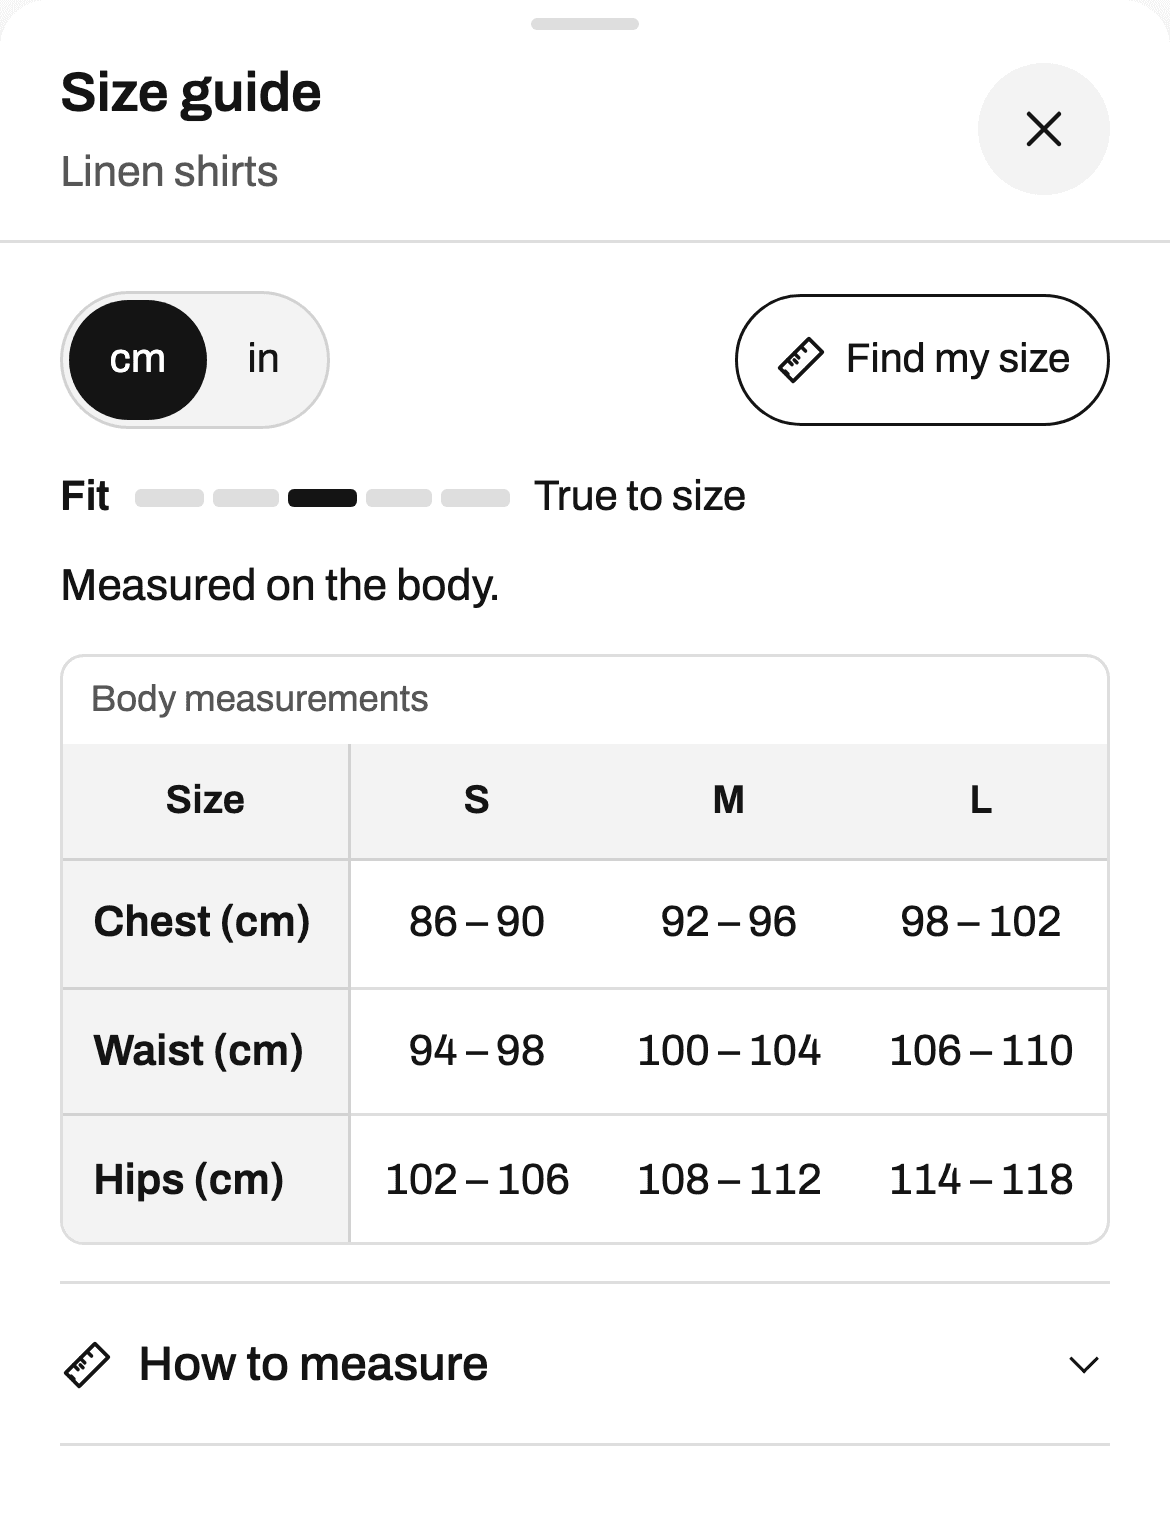
A centered window on a phone leaves little room and puts the close button far from the thumb. A bottom sheet slides up from the bottom edge, keeps a strip of the product page visible above it, and leaves the controls within reach.
Headers that stay in place
When a table is wider or longer than the screen, the header row and the size column should stay where they are as the shopper scrolls. A number then never loses its size or its measurement.
Tap targets of 44 px
The close button, the unit switch and the buttons need room for a fingertip. Apple's design guidelines give 44 points as the minimum for a touch target, and Ruban Size keeps its targets at 44 px on phones.
Input fields at 16 px
On an iPhone, tapping a field whose text is smaller than 16 px zooms the whole page in, and the shopper has to zoom back out. Fields at 16 px leave the page where it is. This matters as soon as the guide asks for a measurement.
Fewer columns at once
Show one size system at a time, with a switch, instead of US, UK and EU side by side. Show one unit at a time, with a switch, instead of both. Put a top and a bottom chart in tabs instead of one long table. Each of these takes columns off a narrow screen.
A size from measurements
Reading a table on a phone is still work. Find my size lets the shopper type a chest or a waist and get one size, "Your size: M", with a line per measurement and how sure the answer is. It's remembered on the shopper's device and shown on every product after that. The Find my size page shows how it decides.
Try it on your phone
This is the real size guide of the women's tops template, the one a store shows. Open this page on a phone, switch units, and try Find my size.
Turning image charts into tables
You don't have to retype every chart:
- Paste it. If the original is a spreadsheet, copy the cells and paste them into the Ruban Size editor, on every plan. Ranges like 35-36, fractions like 38 1/8 and heights like 5′9″ are read as numbers, so they convert.
- Let the AI import read it. On Pro and Fit, it reads a photo (PNG, JPEG, WebP or GIF), a PDF, a public web page or a product description into a draft chart. Values it can't read are left empty and flagged, so you check each one before the chart shows anywhere. No credits to buy.
- Start from a template. 39 templates with typical measurements and a how to measure guide, ready to adjust to your brand, on the templates page.
The import and export page covers the AI import, and the size chart editor covers what a chart can hold besides the table.
A phone test for the chart you have now
Use a real phone, not a desktop browser made narrow:
- Open a product page and find the size guide without scrolling past the buy button.
- Open it with one thumb.
- Read the chest of your largest size without zooming.
- Switch to the other unit.
- Close it, and find the Add to cart button again.
- Turn up your phone's text size and do it once more.
Any step that fails is a step a shopper fails too. The link's position matters as much as the table: more in where to put the size chart. The design page shows the layouts and the phone settings.
Questions
Why is my size chart blurry or tiny on mobile?
It's probably an image made at desktop width. A phone shrinks it to fit the screen, so its text gets small, and zooming in on a compressed image makes it blurry. A table made of text stays sharp at any size.
How do I make a Shopify size chart mobile friendly?
Use a real table instead of an image, open it in a panel that slides up from the bottom, keep the header row and size column in place as shoppers scroll, and give buttons room for a fingertip. A size chart app such as Ruban Size does all of this by default.
Can I turn a size chart image into a table?
Yes. In Ruban Size, on Pro and Fit, the AI import reads a photo or a PDF of a chart into a draft table, and leaves empty and flags any value it can't read. You check the values, then publish.
Should a size chart open as a popup on phones?
A panel that slides up from the bottom works better than a centered popup: the page stays visible above it and the controls are within reach of the thumb. In Ruban Size, the popup layout does this on phones by itself.
Keep reading
- Shopify guidesWhere to put the size chart on a product pageRight next to the size option, above Add to cart, as a link that opens the chart without leaving the page. On phones, a panel that slides up from the bottom. Inline and accordion layouts suit pages where the chart belongs in the details.5 min
- Size conversionCentimeters to inches for size charts, fractions includedAn inch is exactly 2.54 cm, so divide centimeters by 2.54. Round body measurements to the quarter inch, small ones like hands and feet to the eighth, and heights to the whole inch in feet and inches.5 min
- Shopify guidesHow to add a size chart to ShopifyShopify has no size chart tool of its own, so you add one with an image, a page, metafields or an app. An app gives you real tables, the right chart on each product and a cm/in switch; the other ways mostly get you an image.6 min
- Shopify guidesHow to show a different size chart on each Shopify productLet the data your products already carry pick the chart. A rule on a tag, a product type, a vendor or a collection covers most catalogs, title and SKU conditions catch the rest, and exclusions and priority settle the overlaps.6 min